Extensions:2.6/Py/Scripts/NeuroMorph/Proximity Analysis Tools
< Extensions:2.6 | Py | Scripts | NeuroMorph
| UI location | View3D » Proximity Analysis | ||
|---|---|---|---|
| Version | 1.0.0 | Author(s) | Anne Jorstad |
| Blender | 2.78 | License | GPL |
| File name | NeuroMorph_Proximity_Analysis.py |
|---|---|
| Current version download | https://github.com/NeuroMorph-EPFL/NeuroMorph/tree/master/NeuroMorph_Proximity_Analysis |
目次
NeuroMorph Links
Blender Wiki Home
Code on GitHub
For more information please visit the NeuroMorph project website.
Overview
The Proximity Analysis module calculates the regions of two surfaces that are within a given distance of each other. Provides meshes and outputs surface area data for analysis.
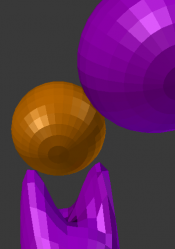
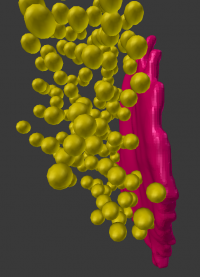
The Sphere to Surface Distances tool computes the closest distance from each vesicle sphere to a synapse mesh. Outputs list of distances from each vesicle.
Proximity Analysis: Description
Selecting Objects for Analysis
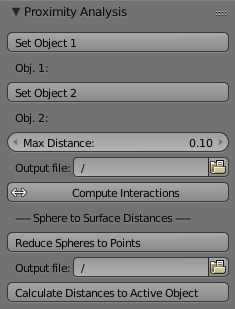
- Select first object, then click Set Object 1.
- Select second object, then click Set Object 2.
- Object order does not matter.
Define Search Distance
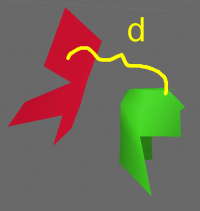
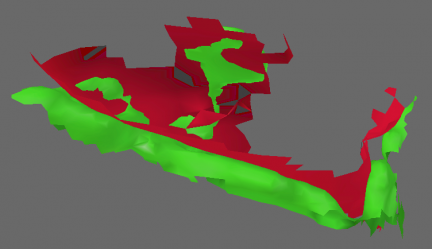
- Enter the desired search distance as the "Max Distance". The computation will search for all distinct regions of the two object surfaces that are within this distance of each other. See "d" in the image below.
Perform Calculation
- Define the output file name and location where the interacting region surface areas will be exported.
- Click Compute Interactions. Computation time grows exponentially with the number of vertices, so can take minutes (or even hours) for large objects.
Output
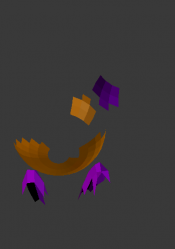
- All interacting sub-regions of the two input objects will be created as children of the original objects. The objects are initially not visible, but can be viewed individually, or all made visible using the NeuroMorph Parent-Child Tools. For example, see image of two interacting regions below.
- The output .csv file contains a column with the names of the sub-regions of the first object (eg ob1.001), their surface areas, the corresponding regions of the second object (eg ob2.027), their surface areas, and the centroid of the two regions.
- Note: Regions where Surface Area = 0:
- Edges and vertices that are not part of any faces are removed at the end of the procedure. This means that there may be a region of mesh faces on one object with no corresponding region on the second object, because the corresponding region consisted only of vertices or edges, so had a surface area of 0.
- Note: Doubly counted overlapping regions:
- The provided results consist of pairs of individual contiguous mesh regions from each object. If a region on one object corresponds to two separate regions on the second object, its surface area will be included in two separate entries in the output file. For this reason, summing the interacting surface areas may result in a greater overall surface area than the true area in space. This may be the desired result, depending on the application.
- The last line of the output file provides the total non-overlapping surface area for each object. (This total is created by joining all sub-regions and removing doubles.)
Sphere to Surface Distances
This tool computes the closest distance from the center of each sphere (vesicle) to a mesh surface (synapse).
Set-up:
- Each vesicle is assumed to be a spherical mesh object. The shape of the vesicle objects is ignored, and distances are calculated from the center of mass of each vesicle object.
- The vesicle spheres are all distinct child objects of the synapse mesh object.
- The synapse object has no child objects other than the vesicle spheres.
- The synapse object can be either a 2D surface or the outline of a 3D solid object.
To Use:
- Optional Reduce Spheres to Points: replaces all children of selected object with a single vertex at each of their center points. Useful when large numbers of child objects are slowing down your interface.
- Define the output file name and location.
- Select the synapse object (with vesicle children), then click Calculate Distances to Active Object. Calculation may take several minutes depending on the number of objects and the size of the synapse. Output file containing distances from each vesicle will be generated at the end of the operation.
